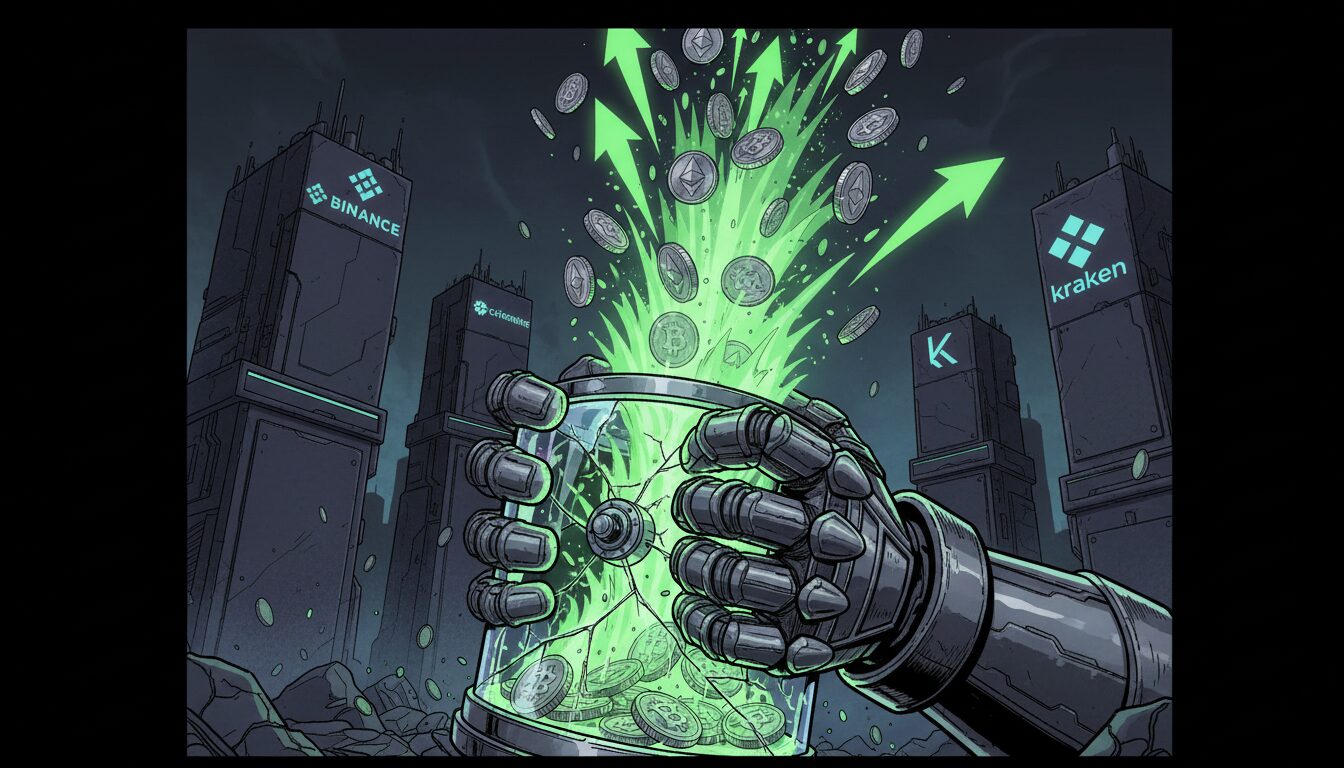
Ethereum Supply on Exchanges Hits New Low, Signaling Potential Squeeze

Key on-chain and derivatives metrics suggest Ethereum may be heading toward a supply squeeze, echoing patterns seen before previous bull runs. With the supply of ETH on exchanges falling to its lowest point this year and large investors steadily accumulating, the market is showing signs of quietly building pressure beneath a surface of calm price action.
Exchange Reserves Dwindle as Whales Accumulate
According to data from CryptoQuant, the total amount of Ethereum held in exchange reserves has dropped to approximately $60.8 billion, marking a new low for the year. A shrinking supply on trading platforms is a significant indicator, as it suggests fewer tokens are readily available for sale. This reduction in liquid supply can amplify price movements when demand increases.
This trend is happening as large-scale investors, or “whales,” have been consistently buying ETH on spot markets. This quiet accumulation, often unnoticed by the broader market, removes even more supply from circulation. Historically, similar periods of declining exchange reserves combined with steady whale buying have preceded significant upward price trends for Ethereum, most notably during the 2020–2021 rally.
Derivatives Market Shows Cautious Confidence Returning
The derivatives market is also painting a picture of returning confidence. After a recent wave of liquidations, Ethereum’s aggregated Open Interest (OI) has stabilized around $19 billion. This stabilization indicates that traders are beginning to open new positions after the recent market shakeout.
Furthermore, funding rates have turned slightly positive, hovering near 0.008%. In simple terms, this means traders are once again willing to pay a small premium to hold long positions, a classic sign of a mildly positive market bias. While the sentiment remains cautious, this shift away from negative funding suggests speculative interest is slowly returning.
Price Consolidates While Underlying Pressure Mounts
At the time of writing, ETH is trading around $3,900, consolidating within a tight range between $3,800 and $4,000. Technical indicators reflect this muted activity, with the Relative Strength Index (RSI) near 42, signaling neutral momentum. Similarly, the On-Balance Volume (OBV) shows that accumulation has been slow and steady rather than aggressive.
The current price range is a critical battleground. A decisive break above $4,200 could signal a bullish continuation, while a drop below the $3,800 support level could open the door to lower targets near $3,600. Although surface-level momentum appears soft, the underlying dynamics of a shrinking supply and steady accumulation suggest that pressure is quietly building for a potentially significant market move.
Disclaimer: The information provided in this article is for informational purposes only and does not constitute financial advice, investment advice, or any other sort of advice. You should not treat any of the website’s content as such. Always conduct your own research and consult with a professional financial advisor before making any investment decisions.


